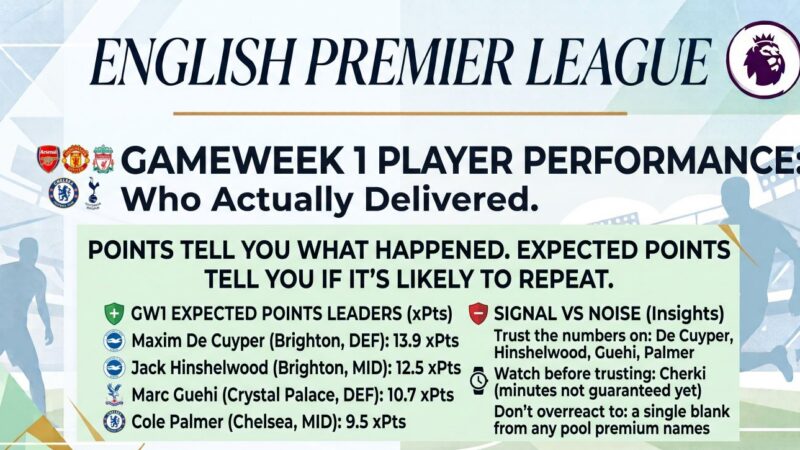
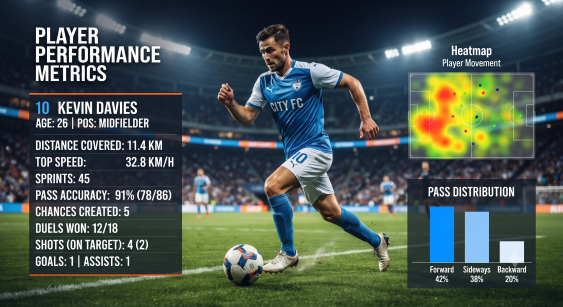
📊 Gameweek 38 Player Performance Metrics
Statistics have a reputation problem in FPL circles. Half the community swears by the numbers. The other half watches a player score three goals in two games, ignores every underlying metric, and feels vindicated until the player blanks for six weeks while posting excellent xG. Both camps are missing something.
The truth is that stats and judgment work best together. Here’s how to use the numbers without becoming the kind of person who refuses to captain anyone without a spreadsheet.
xG and xA — what they actually mean
Expected Goals (xG) assigns a value between 0 and 1 to every shot based on where it was taken, the angle, the type of chance, and whether it was a header or a foot effort. Think of xG as a way to rate every shot a player takes — when you add those values up over several games, you get a clear picture of the quality of chances they’re getting, regardless of whether they actually scored. Premier League
Expected Assists (xA) does the same for chance creation — it measures the quality of the pass or cross that led to a shot, not just whether the shot went in.
Put xG and xA together and you get xGI — Expected Goal Involvement — which gives a player’s total attacking threat in a single number. FPL Copilot
Why does this matter for FPL? Because goals and assists are noisy. A striker can go three weeks without scoring while posting a 0.9 xG across those games. That’s not a drought — that’s bad luck and slightly dodgy finishing. The underlying numbers say he’s getting into the right positions. A player consistently generating high xG and xA is likely to keep delivering points — tracking these metrics over a few gameweeks lets you spot form trends and adjust your squad before the price rises. Fantasy Football Scout
The reverse is equally useful. Players with a low xG but a high goal tally may not sustain their form, since they rely on extraordinary finishing or luck. Likewise, a player with lots of assists but low xA might be benefiting from teammates converting difficult chances. Both cases are worth being cautious about. Fantasy Football Scout
The ICT Index — useful but limited
The ICT Index measures Influence (involvement in attacks leading to goals), Creativity (chance creation), and Threat (goal-scoring potential). It’s built into the official FPL site and gives a quick read on attacking involvement. The problem is it’s a blunt instrument — it won’t tell you whether a player’s Creativity score comes from quality chances or speculative long-range crosses that never trouble anyone. NBC Sports
Use it as a starting point. Don’t use it as a conclusion.
Points per game and value — the underrated pair
Two stats that don’t get enough attention: points per game and points per million. Points per game gives a better indication of how well a player has fared if they’ve been sidelined for a period through injury or suspension — total points flatter players who’ve been ever-present and penalise those who missed games through no fault of their own. Points per million (sometimes called value) shows how efficiently a player converts their price into FPL returns. A £5.5m midfielder posting 7 points per game is doing something remarkable. A £12m forward posting 7 points per game is underperforming. FPL Copilot
Tools like FPL Stats Pro provide over 25 metrics per player including xG, xA, points per game, points per million, ICT index, bonus points per game, clean sheets, and defensive actions — all available as per-game averages for fair comparison across players with different minutes. AllaboutFPL
Bonus points — more predictable than you think
Bonus points are not random. Players who rack up key passes, big chances created, successful dribbles, and defensive actions consistently top the BPS leaderboard. It’s worth checking which players in your squad are regular bonus point earners — and which ones never seem to get them despite scoring. Knowing this in advance shapes your captaincy and transfer decisions more than most managers realise.
The overperformer/underperformer gap
One of the most practical uses of xG data is identifying players who are significantly over or underperforming their underlying numbers. Sites like xGStat flag players well above their xG difference — the overperformers who may be due regression — and those well below it, who are candidates to start converting soon. Buying an underperformer with good fixtures before the goals start arriving is one of the cleanest edges available in FPL. NBC Sports
The numbers don’t guarantee anything. Football remains stubbornly human. But they tell you where the probability sits — and in a game of 38 gameweeks, probability tends to win.